 https://hendricksfamilyfoundation.org/wp-content/uploads/2025/11/lincoln_academy_eclipse_neighborhood.jpg
675
1000
Richard McGrath
https://hendricksfamilyfoundation.org/wp-content/uploads/2023/06/hendricks_family_foundation_logo_wht.png
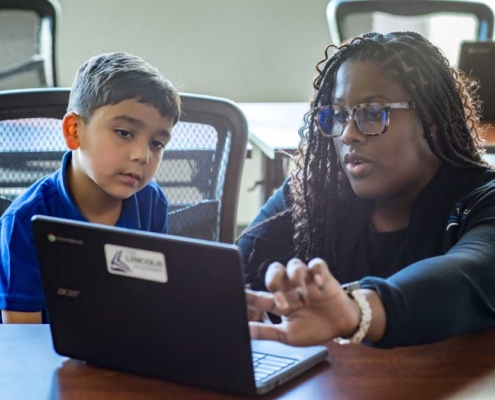
Richard McGrath2025-11-20 13:46:462025-11-21 13:32:17The Lincoln Academy and the Eclipse Park Neighborhood
https://hendricksfamilyfoundation.org/wp-content/uploads/2025/11/lincoln_academy_eclipse_neighborhood.jpg
675
1000
Richard McGrath
https://hendricksfamilyfoundation.org/wp-content/uploads/2023/06/hendricks_family_foundation_logo_wht.png
Richard McGrath2025-11-20 13:46:462025-11-21 13:32:17The Lincoln Academy and the Eclipse Park NeighborhoodThe School District of Beloit Data Tool
“Facts are better than dreams.” Winston Churchill
The Hendricks Family Foundation has been deeply engaged in the issue of education in Beloit for more than a decade. The reasons are likely obvious. A quality education is the most valuable tool we can provide to our children and the success of our educational institutions have a real and direct impact on our ability to thrive as a community. Yet it is a secret to no one, that we have and continue to struggle to ensure that all Beloit children are successful in learning and finish their K12 education with the skills and tools they need to thrive in life.
“Accurate and objective data is critical, particularly if we rely on that data to facilitate decision-making and problem-solving.”
In the book, Good to Great, author Jim Collins, describes what his team defined as ‘the Stocksdale Paradox.’ Their definition centered on the idea that great organizations act on a set of beliefs that can sometimes seem to be in conflict. First, they firmly accept and confront the brutal facts of their current reality and at the same time, hold to an unwavering faith in the endgame. For our community that means we must be willing to acknowledge and address the realities of our academic performance. We must commit to do better for our children. And we must do so amidst – and in spite of – the district’s current financial situation.
A few basic facts:
-
- In the most recent year the school district was responsible for educating approximately 5,000 students.
- Based on the report card released in fall 2024 the district ranked 420 of 421 districts in the state.
- The district has been steadily losing students to open enrollment for years. In 2022-23, the net loss was nearly 800 students. This does not include additional students who exited for choice, charter or homeschool options.
- Financially, the district has had two recent failed referendums and is going back to local voters for a third time in April 2025. The districts fund balance has fallen below $10 million, well below the 18% required by board policies.
In 2024, the Hendricks Family Foundation awarded a grant of $15,000 to the Beloit Public Library Foundation to support the development of a data tool for the School District of Beloit. The tool, publicly released in December, was produced by the Wisconsin Policy Forum, a nonpartisan, independent policy research organization. Data was drawn from publicly available data from the Department of Public Instruction (DPI). The school district of Beloit was involved in the development of the tool.
The tool is intended to provide local citizens and stakeholders with factual and objective information, presented in a user-friendly format. It provides data about the district over time. Financial data is presented on a per pupil basis. The tool makes comparisons to statewide peers deemed comparable in terms of demographics and district size, as well as to other local districts. Available data covers student and teacher demographics, teacher turnover, enrollment, finance, and academic achievement. While it may not be a perfect tool, the dashboard does allow citizens to access factual information, information that may generate additional questions and help citizens draw their own conclusions related to performance.
With respect to academic achievement and finance, two of the most commonly debated issues locally, key dashboard data points include the following:
Academic Achievement
-
- In 2023-24, the average ACT score for a Beloit student was 14.6; black students averaged 13.5 compared to white students at 16. Low-income students averaged 14.3. Beloit has the lowest composite ACT score among both statewide peers and local districts.
- The Grade 3 ELA proficiency score for Beloit was 21.7%. This cannot be compared to prior years because of DPI changes to testing standards. Beloit’s 3rd grade ELA proficiency is less than half of all local districts. Beloit exceeded only Milwaukee in statewide comparisons, 21.7% to 20.9%.
- Grade 8 Math proficiency for Beloit was 17.6%. Beloit had the lowest proficiency among statewide peers and other local districts.
- In 2022-23, chronic absenteeism in Beloit was 40.2% and the graduation rate was 79.5%. The comparison of statewide peers on both measures indicates Beloit’s performance exceeds Milwaukee alone. Beloit’s absenteeism is significantly higher than all other local districts and the graduation rate is nearly 15% lower than the next lowest local district.
Note regarding data points: ACT data was selected because it was not impacted as a result of recent changes to state level testing standards. Grade 3 ELA and Grade 8 math are included here because they are considered key developmental measures and given extra weight on school report cards. Data for absenteeism and graduation lags other measures and the most recent data is from 2022-23.
Financial Data
-
- Beloit’s operating revenue is 19% greater than the state average. On a per pupil basis the district received $19,904 in 2022-23 compared to $15,034 in 2018-19. The district’s operating revenue is substantially higher than the Janesville and Turner Districts at $14,755 and $12,591, respectively.
- Beloit’s state aid of $15,907 is nearly double the state average of $8,238. Beloit’s property tax levy per student is negligible at $25.
- Beloit’s expenditures on teaching instruction are $17,908, 10% higher than the state average. Beloit’s expenditures on teaching instruction are similar to Janesville but considerable higher than Beloit Turner.
- Beloit’s central administration costs are not substantially higher than the state average. Beloit spends substantially more on instructional support staff and building administration.
Note regarding data points: 2022-23 is the most recently available financial information from DPI. Janesville and Beloit Turner were selected as comparisons due to proximity and open enrollment trends. Additional comparison districts can be accessed by visiting the data tool.
Conclusion
We believe the data tool can be a beneficial tool for our community as we continue to wrestle with important questions about how to improve. We also believe we must be willing to embrace the facts and hold firm to the belief that we can – and must – do better, even amid significant challenges. The future of our children and our community is dependent on our ability to succeed.


![]()
![]()
https://hendricksfamilyfoundation.org/wp-content/uploads/2025/11/lincoln_academy_eclipse_neighborhood.jpg
675
1000
Richard McGrath
https://hendricksfamilyfoundation.org/wp-content/uploads/2023/06/hendricks_family_foundation_logo_wht.png
Richard McGrath2025-11-20 13:46:462025-11-21 13:32:17The Lincoln Academy and the Eclipse Park Neighborhood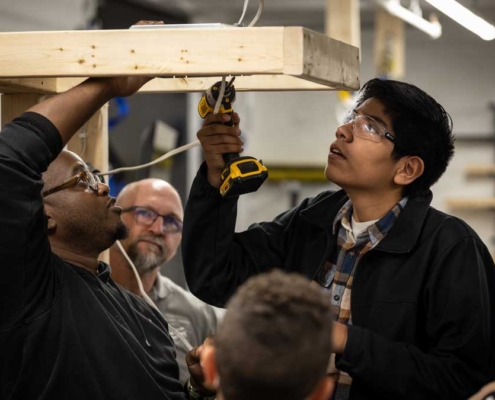 https://hendricksfamilyfoundation.org/wp-content/uploads/2025/10/growing-into-the-vision-d.jpg
675
1000
Richard McGrath
https://hendricksfamilyfoundation.org/wp-content/uploads/2023/06/hendricks_family_foundation_logo_wht.png
Richard McGrath2025-10-10 12:17:522025-10-20 11:03:03Hendricks CareerTEK | Growing into the Vision
https://hendricksfamilyfoundation.org/wp-content/uploads/2025/10/growing-into-the-vision-d.jpg
675
1000
Richard McGrath
https://hendricksfamilyfoundation.org/wp-content/uploads/2023/06/hendricks_family_foundation_logo_wht.png
Richard McGrath2025-10-10 12:17:522025-10-20 11:03:03Hendricks CareerTEK | Growing into the Vision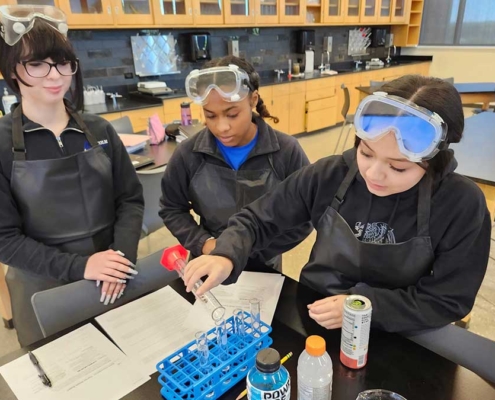 https://hendricksfamilyfoundation.org/wp-content/uploads/2025/07/science-experiment-lincoln-academy-d.jpg
675
1000
Richard McGrath
https://hendricksfamilyfoundation.org/wp-content/uploads/2023/06/hendricks_family_foundation_logo_wht.png
Richard McGrath2025-07-10 15:52:092025-07-10 16:18:29A New Milestone for The Lincoln Academy
https://hendricksfamilyfoundation.org/wp-content/uploads/2025/07/science-experiment-lincoln-academy-d.jpg
675
1000
Richard McGrath
https://hendricksfamilyfoundation.org/wp-content/uploads/2023/06/hendricks_family_foundation_logo_wht.png
Richard McGrath2025-07-10 15:52:092025-07-10 16:18:29A New Milestone for The Lincoln Academy
